 Lifecycle Profiles
Menu Option: General: Lifecycle Profiles
Lifecycle Profiles are used as a centralized way of describing technological behavior profiles and age distributions for stocks of devices across different yearly vintages. For example, one lifecycle profile might be used to describe how the fuel economy of a given type of vehicle worsens as the vehicle ages, another might be used to describe how the emissions of pollutants per unit of energy consumed or per unit of distance traveled increase as vehicles age.
Lifecycle profiles fall into two categories:
-
Aging Profiles describe how a variable changes over time as devices age. These profiles are used in conjunction with a LEAP expression that describes how the characteristics for a new device (fuel economy, emission factors, vehicle mileage, etc.) change over time in any given scenario. The profile is used to describe how a characteristic behaves as a given vintage of devices age. These types of profiles are defined as a percentage value relative to the value of the variable for a brand new device. Thus, the first year value for this type of profile is always 100%.
-
Distribution Profiles describe the distribution of vintages within a given overall stock of devices. They are only used when specifying stocks of devices in Current Accounts.
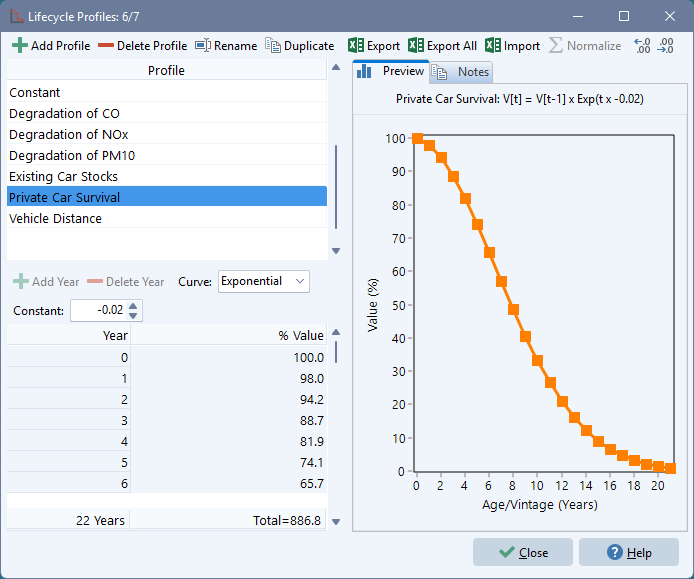
Use the General: Lifecycle Profiles menu option to view and edit a library of different lifecycle profiles for your Area. The screen is structured as two panes. On the left you see a list of profile names and the annual values associated with one selected profile. On the right you see a screen which previews those values. The right-hand-side of the screen can also be used to enter notes documenting the data and assumptions used to create the profile. Click on the Notes tab to enter or view notes for the profile
You can create any number of profiles. Click the  and
and  buttons to add or deleted profiles, and the
  button to rename a profile. Click the Excel buttons (
 ) to buttons to export one or all profiles or import a profile from an Excel spreadsheet. When importing a profile from Excel first mark and name a range of cells in Excel. The range must be either a single column or a single row or cells. LEAP assumes the range represents a contiguous set of values from year zero onwards.
The values for any given profile can be edited in one of two ways. Click on the Curve selection box, then choose whether you wish to enter Data Points via the keyboard, or specify an Exponential curve. In the former case you will be able to enter data in the table on the left of the screen, while in the latter case you will be able to specify the value of the Constant exponent of the curve. The curve itself will then be calculated according to the formula:
V[t] = V[t-1] x Exp(t * Constant)
Use the  and
and  buttons to change the number of decimal places displayed in the table, and when specifying data points,you can use the and buttons to add or delete values.