Final Energy Demand Analysis
See also: Analysis View, Demand Analysis, Useful Energy Demand Analysis
In conducting a final energy demand analysis, a typical approach is to disaggregate your demand data structure into four levels representing sectors, subsectors, end-uses and devices. An example of this approach showing the Activity Level table in the Analysis View is given below.
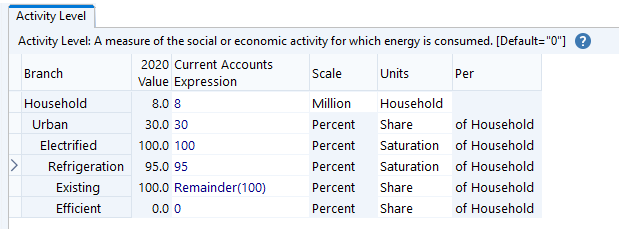
Activity levels for one of the four hierarchical levels are typically described in absolute terms (in this case the number of households is 8 million in the Current Accounts year), while the other three levels are described in proportionate (i.e. percentage share or percentage saturation) terms. In the example shown above, urban households are 30% of the total number of households in 2000, of these 95% have some type of refrigerator, and all refrigerators are existing (less efficient) models. None of the new, more efficient models have been introduced in the base year . Notice that at the top level, the user chose an absolute unit for the activity level (households). At lower levels, LEAP keeps track of the units, and hence knows that the percentage number entered at the second level is the share "of households". In general, LEAP lets you choose the numerator units for activity levels, whilst automatically displaying the denominator unit. When selecting an activity level unit, you can choose from any of the standard non-energy units. Use the Units screen (Main Menu: General Parameters: Units) if you need to add additional units.
The above data are shown for the Current Accounts year, but all values can be altered for future years in scenarios. This allows the planner to capture the combined effects of separate changes at many levels, such as, for example, the growth in the total number of households, the rate of urbanization, the penetration of refrigeration, and the market share of less efficient vs. more efficient refrigerator models. To project these data, you first use the Manage Scenarios option to create one or more scenarios. Then, in the Analysis View, you override the default (constant) expressions entered in Current Accounts for each branch , with new expressions that describe how each value changes over time.
The tree structure for this type of final energy analysis is shown below.
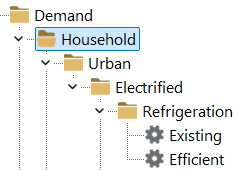
Notice that all of the branches are created as category branches ( ) except for the bottom-most nodes, which are always created as technology branches (
 ). For these bottom-level branches, you also define the annual energy intensities per unit of activity level (in this case per household) and specify the fuels used by the device (see below).
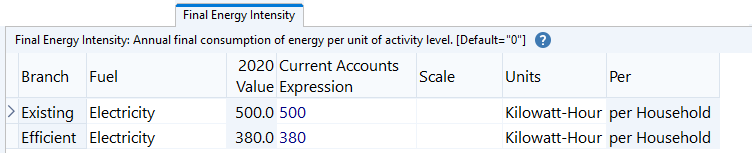
When editing energy intensities, first select the fuel used by each device and then set the scale and units in which you want to enter the intensity. The scale and units columns can only be edited in Current Accounts. Changes to the energy intensity units column subsequent to entering an intensity value will cause LEAP to offer to convert the value to the new units.