 Analysis View
Menu Option: View: Analysis View
See Also: View Bar
The Analysis View is used to:
-
Create the data structures for your area . This is done primarily by editing the Tree shown on the left of the view, which is organized into major categories of information: Key Assumptions, Effects, Demand, Transformation, Resources, Non-Energy Sectors and Indicators.
-
Create and manage alternative scenarios: using the Manage Scenarios screen.
-
Enter the data, assumptions and modeling relationships for each scenario : using the data entry tables on the right-hand side of the screen.
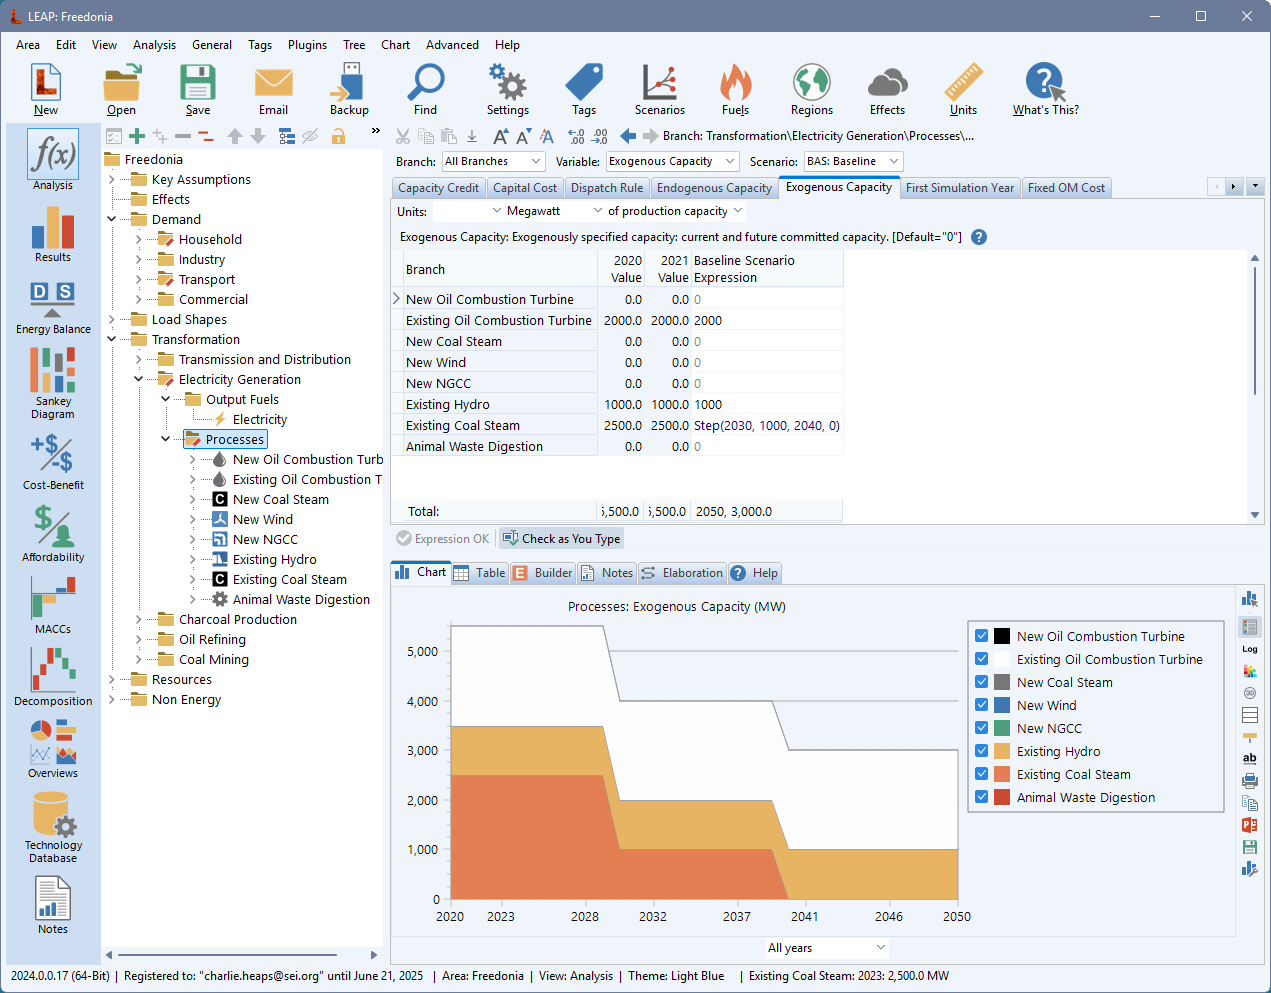
Data Entry Table
The data entry table is used to enter expressions that define the Current Accounts values (base year and historical data) of variables and the future values of each variable for a given scenario. Depending on which tree branches you click on the left of the screen, different data variables will be displayed for editing on the right. For example, when editing demand sectors you will see tabs giving access to "Activity Levels" while at the lowest levels of the tree you will also see tabs for "Final Energy Intensity" and "Environmental Loadings". In addition to specifying values for variables using expressions you can also specify their units and scaling factors.
Variables can be accessed in two different ways:
-
Listed in the Variables selection box. Variables are grouped by category (e.g. basic, capacity, dispatch, cost, user-define, etc.)
-
Listed as tabs above the data entry table. Select a variable by clicking on the tab. You can optionally hide the tabbed view of variables, by right-clicking on Analysis View Toolbar and unchecking "Variables as tabs" You can reinstate the tabs at any time by right-clicking on the data entry table and changing-back this setting.
In general, the rows in each data entry table correspond to the tree branches immediately below the one you clicked on in the tree. For example, if you clicked on the Transformation branch, you will see information about all of the modules in your Transformation analysis. Similarly, if you click on the demand branch for the household sector, the rows of the data entry table will show information about household sub sectors (e.g. urban, rural, depending on the structure you develop). Note though, that when editing Demand activity levels, LEAP also shows you a series of indented rows, which also shows you the activity levels in higher level branches.
The columns of information shown in most data entry tables are broadly similar. You will normally see the following columns:
-
Name: the name of the tree branch being edited. This name cannot be edited in the data entry table. If you want to change it, either click on that name in the tree, or right-click on the row and edit the that row.
-
Current Accounts Value (column header shows year): Only shown when editing scenarios, the data entry table will contain an additional column showing the value for the variable in the last year of the Current Accounts data set. This column of data is not editable. In data where the Current Accounts is just a single year, the value will be the base year value. Where appropriate, the foot of the column will show the total sum of all neighboring current account values.
-
Expression: LEAP borrows an approach made popular in spreadsheets: the ability for users to enter data and models in the form of mathematical expressions. In Current Accounts an expression defines the historical values for a given branch and variable, while in scenarios, the expression defines how that variable changes over time (from the first scenario year to the end year of the study period). Expressions can range from simple numeric values to complex mathematical formulae. For more information, refer to Expressions and Examples of Expressions. As you select different expressions, you will see an orange button (
 ) attached to each expression field. Click this button to get quick access to various functions, such as standard preset values for an expression or commonly used functions that might be appropriate. For example, when showing share variables, the button will give quick access to the Remainder function, or when editing process Dispatch Rule, the button will give access to standard dispatch rules (PercentShare, MeritOrderDispatch, RunningCost, ProportionalToCapacity, etc.). The button also gives quick access to standard editing actions (cut, copy, paste, ditto, etc.), and to common data entry wizards such as the Time-Series wizard, the Branch/Variable wizard, and the Function wizard.
Expressions are color coded to show you which expressions have been entered explicitly in the current scenario, and which are inherited either from a parent scenario, from another region or from the data specified for Current Accounts. For example: Purple text indicates an expression has been entered explicitly in the scenario currently being edited, Black text indicates that a value is inherited from another scenario or another region, Green text indicates an expression is inherited from another region (in a multi-region data set). -
Scale and Units: In many tables, columns are provided for specifying the units of the data you are entering. For some variables, units consist of both a numerator and a denominator unit. Note that in most Transformation data screens, units are not chosen for each branch, but are chosen for a whole group of neighboring processes and output fuels. For these tables, scale and units selection boxes are shown in a panel immediately above the data entry table. The settings you enter for units and scaling factors apply across both Current Accounts data and all scenarios. Note also that the units you choose for data entry in the Analysis View do not have to be the same as the units in which you report your results. LEAP will handle unit conversion calculations for you. Most data can be entered in a choice of units, and LEAP provides a wide range of standard units for energy, power, mass, volume and monetary data. You can also add your own units using the General: Units screen. When entering energy data, LEAP can also assist you to convert data from one unit to another. To avoid entering very large or very small numbers, most LEAP tables include a column in which you can choose scaling factor. Typically you will leave this blank, but you can also choose a factor such as "Thousand", "Million" or "Billion".
Data entry tables for some variables have additional columns. For example, demand energy intensity branches also require that you select the fuel associated with a demand device.
Data Entry Table Right-Click Menu
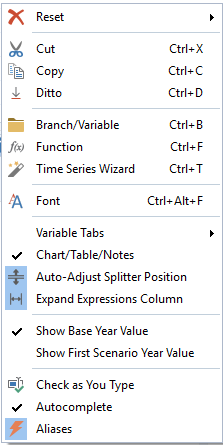 Additional options for controlling the formatting and editing behavior of the data entry grid can be accessed by right-clicking with your mouse on the data entry grid. The right-click menu (shown right) gives access to standard editing options (cut, copy, paste, ditto), and to common data entry wizards such as the Time-Series wizard, the Branch/Variable wizard, and the Function wizard. It also lets you contol the formatting of the table (font size, size of the expression column, whether to display the lower chart/table/notes pane, whether to auto-adjust the size of the data entry table, whether to display extra columns in the data entry table showing the values of expressions in the base and first scemario years, etc.). It also lets you enable or disable the autocomplete feature and the check as you type feature (see below).
Analysis View Toolbar
![]()
Above the data table, you will see a toolbar containing various menu buttons, which are used to filter the rows in the table or select particular branches, variables, scenarios and regions (in multi-region models). There are four menu buttons:
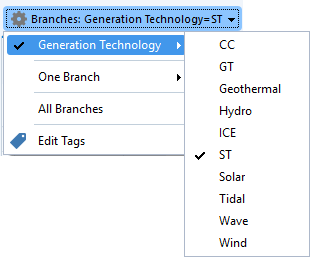 The branch menu (shown right) button lets you select one or all branches or it lets you filter branches based on the tags defined at branches. For example, instead of showing a very long list of power plants you might filter that list to show only combined cycle or steam turbine plants or renewable power plants, or perhaps existing vs. future power plants.
To use tags for filtering branches in Analysis View, use the tag toolbar (SHIFT+F5) below the main tree to add tags to branches. You will then need to assign tags to different tag groups in the Tag Manager screen (F5). You can edit the names of groups of tags or create additional tag groups in the Tag Groups screen (Alt+F5) . Note that any branch can have multiple tags. For example, one power plant could be marked as "Combined Cycle", "Fossil", and "Existing", each of which may be assigned to different tag groups. To use tags for filtering of branches in the Analysis View and Results View, be sure to enable the Use for Results and Filtering check-mark for reach relevant tag group. Bear in mind that you may have some tags that are used only for modeling purposes, and that you do not wish to use for filtering of branches.
- The variable menu button lets you select one or all variables, or choose to show only one category of variables (e.g. all cost variables, or all dispatch-related variables). It also gives quick access to editing and adding user variables.
- The scenario menu button lets you select one particular scenario from the entire tree of scenarios, or it lets you show all scenarios or only those scenarios marked for calculation.
- The region menu button lets you select one region, all regions, or a user-defined group of regions.
Check As You Type Expression Validation
 By default, LEAP's Analysis View employs "Check as You Type" expression validation. This feature actively checks the expressions you enter in real-time. Any errors in an expression are revealed by causing the expression to be displayed in red italicized text. In addition, an error message describing the error is displayed in a toolbar immediately below the data entry table. Click the Check as You Type button to turn this feature off and on.
Chart and Table Tabs
 /
/  The bottom pane of the analysis view displays the data you entered in the top pane as either a chart or a table. The chart and table views let you quickly examine the values generated by the expressions you have entered above. The chart and table tool bars on the right of the pane gives access to a range of options for formatting charts and tables (e.g. picking chart type and stacking options, colors, grid lines, number of decimal places, font size, etc.) and for printing and copying charts and tables, exporting tables to Microsoft Excel, and exporting charts to Microsoft PowerPoint.
Notes Tab
 The bottom pane also gives access to the Notes screen: a word processing tool in which you can enter documentation and references for each branch of the tree. Notes can include formatting (bold, underline, italics, fonts, etc.). See information on the Notes Editor View for more details.
The notes view is linked to the References database, providing a centralized facility for referencing your data and assumptions. To edit the list of References, use the New ( ), Add (
 )and Delete (
 ) buttons to link to the References database.
Expression Builder Tab
The builder tab gives you additional space for editing complex expressions, compared to the data table at the top of the screen. In addition to having more space it also automatically displays a pane with help relevant to the function you are writing. As you position the edit cursor within a particular function, the help page for that function is shown on the right-hand side of the builder. While editing expression in the builder you can format your expressions as multi-line equations, freely using carriage returns to make the expression more readable. The Expression Builder includes a toolbar that gives quick access to editing options such as Cut ( ), Copy (
 ), Paste (
 ) and Undo (
 ). It also gives quick access to various wizards that can help you build your expressions, including (where appropriate) the Time-Series wizard (
 ), the Function Builder () and the Branch/Variable selection wizard (
 ).
).
Once an expression is compete, press the Submit button to move the completed expression back into the data table at the top of the screen.
Expression Elaboration Tab
![]() Expression Elaboration is a tab marked with the
Expression Elaboration is a tab marked with the ![]() button in the bottom pane of the Analysis View screen. It elaborates on complex expressions. The elaboration tab is divided into two panes. On the left it displays a list of the branch/variables that refer to the branch/variable currently highlighted in the above data table. On the right it displays a list of the branch/variables that themselves contain expressions referring to the current branch/variable.
button in the bottom pane of the Analysis View screen. It elaborates on complex expressions. The elaboration tab is divided into two panes. On the left it displays a list of the branch/variables that refer to the branch/variable currently highlighted in the above data table. On the right it displays a list of the branch/variables that themselves contain expressions referring to the current branch/variable.
Help Tab
 The Help tab in the bottom pane of the Analysis View gives immediate access to the help system for whatever variable the user is editing.