Results View
Menu Option: View: Results
See also: View Bar Saving Favorite Charts, Maps, Results View Toolbars, Using Auto-Refresh, Using Tags
Overview
The Results View is the main place in LEAP to look for results in chart, table and map format. It is also the main place where you can debug your results to ensure that your data, assumptions and models are valid and consistent. Tabs at the top of the Results View let you switch between different views of your results:
-
Chart: shows results as bar, column, area, line, pie and radar charts or in various map formats. See this page for more information on using maps with LEAP.
-
Table: shows results in various table formats.
-
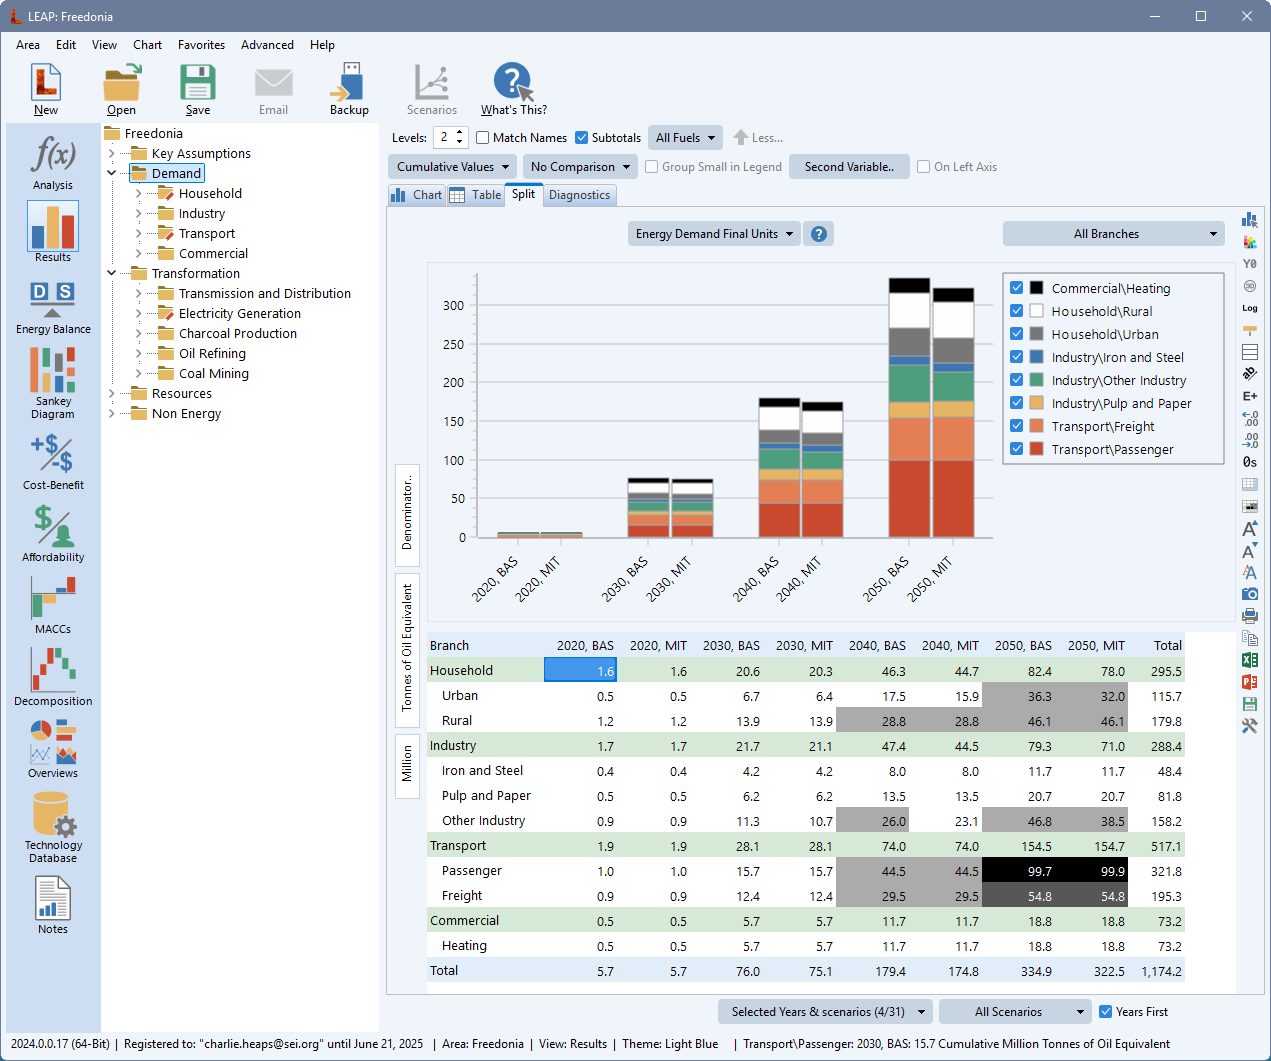
Split: shows results in both chart and table format. You can drag the screen splitter to change the size of the chart and table areas.
-
Diagnostics: shows warnings and informational messages concerning your results calculations. The diagnostics tab only appears if diagnostic messages were generated during calculations.
Once you have selected the desired result you can then switch to the table or chart reports. Use the on-screen buttons and selection boxes to select the results in which you are interested. You can select new results at any time, but typically you will follow the following basic steps:
-
Use the Result selection box at the top of the screen to first pick the type of result you are interested in. For example, you might pick Energy Demand, Social Costs, or One Hundred Year Global Warming Potential.
-
Use the Tree to pick the branches for which you wish to see results. For example, you might choose to see demands for the whole area or for household sector.
-
Use the selection boxes attached to the chart's X Axis and Legend to pick the dimensions you want to see in the chart or table. Different categories of results have different dimensions. For example, energy demand results have the dimensions: years, branches, fuels, and scenarios. You can create a chart showing any two of these dimensions on the X-axis and legend of the chart. Examples of demand charts you can create include: fuel by year (for a given branch and scenario), branch by year, for one or all fuels and a given scenario, scenarios by year (for a given branch and one or all fuels), etc. Those dimensions not placed on the X axis or legend are listed in the Results View tool bar, allowing you to pick one item (or where appropriate the total of all items) for that dimension. So for example, if you chose to view a scenario by year for energy demands, you can also use the tool bar to choose whether you wish to display results for one fuel, or the total for all or selected fuels. When picking a dimension for the X axis or legend you will also be able to specify whether you want to show all items in the dimension or only selected items. If you choose "Selected..." you will be shown a dialog box in which you can select the items to be displayed.
-
Use the Chart Type button (
 ) to select among different chart types including, line, bar, area, pie and radar charts or various map formats.
 -
Use the various additional on-screen controls to further customize your chart.
-
The Scale and Units buttons shown on the chart or table left axis are used to pick the scaling factor and unit for the chart. The class of the unit (energy, power, mass, volume, etc.) is determined by the category of result you are examining. LEAP automatically chooses a scaling factor (thousands, millions, billions, etc.), but you can subsequently override this by clicking the scaling button. For most reports, you can also choose a Denominator variable. For example, you may wish to view energy demand per unit of GDP, or CO2 emissions per person. Click on the Denominator button to set or remove the denominator variable.
-
-
To reduce the complexity of the screen and to save space, additional advanced reporting options are hidden by default. To display the following options, click on the More button. This causes a secondary tool bar to appear with the following options:
-
-
Use the Values selection box to select among absolute, percentage, cumulative or indexed values or to show year-on-year growth rates.
-
Use the Comparison selection box to see the differences between scenarios, values avoided versus another scenario or a wedge chart showing the total value for one scenario and a series of wedges showing how the elements of a scenario were reduced relative to another scenario.
-
When viewing cost results, an additional Costs selection box appears, letting you choose either real (i.e. constant value) costs or discounted costs.
-
 Using Tags in Results Reports
If you have created tags in your LEAP area and associated them with branches then you can also use these as an additional dimension in your Results View charts and tables. To use tags in your reports, you need to follow a few basic guidelines :
- Firstly, create groups of tags and make sure that all tags are assigned to a tag group.
- In the Tags: Tag Groups screen (), put a check in the Use For Results column for any Tag Groups you want to use as an extra reporting dimension.
- Finally, when adding tags to branches using the Tag Toolbar in Analysis View, make sure that any branch only has one tag from each tag group. For example you might have two tags named "new" and "existing" used to tag all of your electric generation technologies. Both of these could be assigned to a tag group named "Status", but each branch should only be tagged as either existing or new: not both. LEAP will warn you if you try to add more than one tag from the same group to a single branch.
Once you have followed these steps, groups of tags will automatically appear as an additional dimension in your Results View charts. LEAP will automatically warn you if any branches have multiple clashing tags (for the current tag group), since this would lead to double-counting of results. If groups of tags are not selected on the x axis or legend, you can still filter any results shown in a chart or table, using the selection box that appears above the chart or table, where appropriate.
A few points to bear in mind: (1) tags will only appear as a dimension in Results view if you have both defined some tags and added those tags to some of the branches in the tree. Use the Tag tool bar in Analysis View to add tags to the tree. (2) When selecting a group of tags as a dimension for a chart legend, LEAP will also color code the branches in the tree to show the tags associated with each tree branch. Use the Tree popup menu if you want to switch off color coding of tree branches in Results view.
Composite Dimensions
Two dimensions of a result can be combined on the X axis of charts, making it possible to create a greater range of chart types. These "composite dimension" charts are particularly useful for making multiple side-by-side charts all sharing the same Y axis. For example, you can create charts that compare results across selected years, scenarios or regions. The list of composite dimensions available depends on the type of results being plotted and includes Scenarios & Time Slices, Scenarios & Branches, Scenarios & Fuels, Scenarios & Regions, Years & Time Slices, Years & Scenarios, Years & Branches, Year & Regions, Years & Fuels, Years & Effects, and Regions & Time Slices.
Composite dimensions can be selected via the button below the X axis in Results View. Look for the sub menu option labeled "Composite Dimensions" for options. Once a composite dimension is selected, an additional button will appear below the X axis from which you can choose all or selected elements of the second dimension. A checkbox next to that lets you select the order in which the dimensions are plotted. For example, when selecting Years & Scenarios, you can plot separate charts for each scenario with each chart showing years, or you can plot one chart for each year comparing values across scenarios. You can also choose to display all or selected items for each dimension.
When working with time slices, buttons in the "selected" dialog let you filter time slices to show the slices for a particular season, day type, or time of day, with the choices depending on how you have configured your time slices. Similarly, when working with fuels you can quickly select fuels from a particular fuel group (e.g. all oil products).
An example of a chart with composite dimensions is shown below, with results for time-sliced power production animated by year including the energy consumed or produced in different time slices by storage technologies.

When showing composite dimensions on a chart X axis, you can choose various options for formatting X axis labels. By default, the names of the items in the first dimension are shown as labels across the top of the chart (as shown above), with the items from the second dimension shown as the chart's X axis labels. If you prefer, you can also show both the first and second dimension names entirely on the X axis separated by a colon or you can show first dimesion names on the chart and both first and second dimension names on the X axis. To adjust these options clik on the label button ( ) in the chart toolbar, choose Labels... and then select Composite Dimension Labels.
Multi-Level and Cross-Tabulated Reports
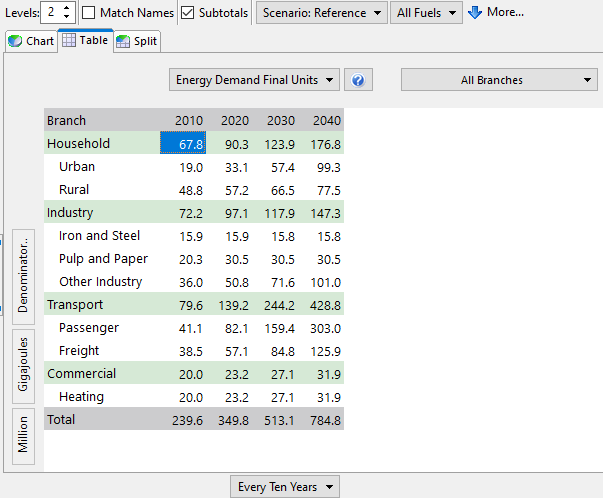
When showing charts or tables with branches displayed in the legend, you can also make use of the Levels spin edit to control the number of levels displayed in the charts and table. Choosing "0" (zero) displays results only for the currently selected tree branch. Choosing "1" shows results disaggregated to show the branches immediately the currently selected tree branch (i.e. its children). Choosing "2" shows the grandchildren branches, etc. The maximum number of levels supported is seven. When displaying multiple levels, you can also click on the Match Names check box to group branches where the bottom branch has the same name. This can be very useful, for example, if you want to see total cooking or lighting energy consumption across multiple income groups or across urban and rural households. When viewing multi-level results in a tabular format, you can also use the subtotals check box to show results at each different level. These tables are color coded to make it easy to interpret detailed results and to see subtotals at different levels of disaggregation. An example of this is shown below.
Results View Toolbars
- Use the Chart toolbar on the right of the screen (or right-click on a chart) to customize the appearance of charts, to copy results to the Windows clipboard (
 ), and to print (
 ) or export results to Microsoft Excel (
 ) and PowerPoint (
 ). Options on the toolbar let you select the type of chart (), and formatting options such as grid lines (
 ), log scales (
 ) and 3D effects in line charts only (
 ). The toolbar also contains options for further customizing the chart. For example you can use the camera button (
 ) to add a background image.
Use the advanced button ( ) to further format your charts. From here you can change the width of lines, set the maximum number of series when smaller series are grouped together into an "other" category, and control how colors are used in charts when plotting fuels, regions, scenarios and effects. You can choose to use consistent coloring across different charts so that (for example a fuel) always looks the same color, or you can choose to minimize the use of shading to make an individual chart look as clear as possible. Other options let you hide blank series and control how borders are drawn in bar charts. Finally, the More Chart Settings option lets you fine tune almost every setting in a chart. This can be useful immediately before printing or exporting a chart, but note that these settings are not retained once you select another chart.
Use the labels button () to adjust the display of labels on the chart X axis. In addition to selecting the rotation of lables (0°, 45°, 90°, 270°), the labels menu lets you select various other display options that are useful when there are many items or when labels are long. You can now choose to Wrap Long Labels, to show Alternating low & high labels when the label rotation is zero degrees (to make more room for more labels), and you can show or Hide Overlapping Labels. Normally, we recommend hiding overlapping labels, but this option can be useful when labels are very close together, since the overlap-prevention algorithm can sometimes be inaccurate.
- For tables, you can use a similar toolbar to edit the number of decimal places (
 /
/ ), the size of the table font (
 /
/ ) and its typeface (
 ), and the formatting of zero values (
 ). You can also use the Table Statistics button (
 ) to select which additional statistics are included in the table beyond the basic values calculated in LEAP. The default statistics includes row and column total values. You can also select minimum and maximum values as well as growth rates, mean, median, standard deviation and variance statistics. In some tables, where the data allows, you can also display indexes showing the ratio of end year to base year values or the ratio of end year to the last historical year values. In addition to these statistics you can also use the heat map button (
 ) to highlight the lowest and highest values in a table. Using this option, the table values are grouped into thirds, quartiles, quintiles, deciles, or percentiles and the table values are then shaded according to which group the cell values belong to. Tables can also be exported to Excel (), copied () or printed (). The advanced button (
 ) let you set the maximum number of series when smaller series are grouped together into an "other" category and also lets you hide entirely blank series (rows)
When showing the split view (chart and table together), the toolbar will show options relevant to both charts and tables.
Favorite Charts
You can save your favorite charts including all settings for the axes, type of chart, and formatting, using the Favorites menu. This feature is similar to the bookmark/favorites features found on popular Internet browsing software. Later, in the Overviews View, you can group together favorite charts to create overviews of different results. Use the Save Chart as Favorite option to bookmark the current highlighted chart. You will be asked to give the favorite a name. Use the Delete Favorite option to delete the saved favorite. To switch to a favorite chart, select its name from the favorites menu. You can organize your favorite charts using the Manage Favorites screen.
Using Auto-Refresh
By default, Auto-Refresh is on and results are updated immediately when you make any change to the various selections in Results View. For larger data sets where refreshing results is slower or in cases where you want to make many selections at the same time, this behavior be inconvenient. For these situations, you can switch off Auto-Refresh and then use the Refresh button ( ) to manually force the chart or table to be refreshed.
The Tree in Results View
When showing results with tags or branches selected for the chart legend, LEAP can color code the tree using the same colors as used in the chart. This makes it easy to see how the results in the chart correspond to the branches in the tree (or the tags set at those branches). When branches are the selected dimension in the Chart legend, LEAP will automatically expand the tree to show you the colored tree branches corresponding with the items in the chart. This capability also works if you have more than one depth level selected. If you do not wish to have the tree color-coded you can switch off this capability from the View menu using the View: Color Tree Branches ( ) option.